
Drawdown Magnitude and Recovery Duration of Semis During USD Liquidity Crises
Semiconductor stocks have a habit of reminding investors that progress is not a straight line. Periods of explosive growth, fueled by new technologies and insatiable demand for chips, are often followed by brutal drawdowns when the macro environment turns. Among the most stressful of these episodes are USD liquidity crises—moments when dollar funding dries up, credit spreads widen, and global markets scramble for access to the world’s reserve currency. In those periods, the magnitude of semiconductor drawdowns and the duration of their recoveries tend to reflect not just sector-specific forces, but the broader macro linkage of interest rates, exchange rates, credit conditions, and commodities.

The title sounds almost clinical: “Drawdown Magnitude and Recovery Duration of Semis During USD Liquidity Crises.” But beneath this phrase lies a richly textured story of how a globally essential, capital-intensive, and deeply cyclical industry reacts when the financial system is suddenly short of dollars. Understanding that story requires a flexible lens, one that moves between sector dynamics and macro structures, and that accepts that different crises produce different patterns even if they rhyme.
What Makes USD Liquidity Crises Special?
To start, USD liquidity crises are not just simple market selloffs. They are episodes where demand for dollars spikes—because of deleveraging, margin calls, or funding stress—while supply becomes constrained. Banks tighten dollar lending, offshore dollar markets seize up, and investors dump risky assets to raise cash. The dollar itself may surge, financial conditions tighten abruptly, and even fundamentally strong companies find that rolling debt or financing working capital becomes harder and more expensive.
Semiconductors sit squarely in the crosshairs of such episodes. The sector is global, export-driven, and heavily reliant on cross-border supply chains. Many firms borrow in dollars or rely on customers who do. Capital expenditure plans are denominated in large, long-term commitments, often backed by dollar funding or dollar-linked contracts. When dollar liquidity dries up, these flows are disrupted. The result is usually not a gentle repricing but a sharp, disorderly drawdown in semiconductor equities as investors rush to reduce exposure to capital-intensive, globally exposed industries.
Drawdown Magnitude: Why Semis Fall So Far
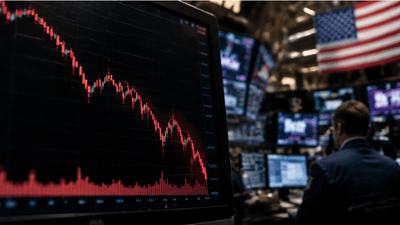
Historical cycles show that semiconductor indices can suffer large drawdowns even outside of explicit liquidity crises, with peak-to-trough declines ranging from moderate corrections to collapses exceeding 60–80 percent. During USD liquidity stress, that vulnerability tends to be amplified. Several forces converge to increase drawdown magnitude.
First, semis are often priced as high-beta growth assets. Their valuations embed expectations of strong future demand, margin resilience, and technological leadership. Liquidity crises flip the script: investors suddenly care more about near-term solvency and funding than long-term stories. Price-to-earnings multiples compress, and highly valued names see outsized declines as the market re-prices risk. Second, the sector’s earnings can be leveraged to global demand and trade. A surging dollar and tightening financial conditions dampen demand in weaker economies, curbing orders for electronics, autos, and industrial systems—all major chip end markets. Finally, the capital-intensive nature of semis adds another layer: investors worry about whether planned capacity expansions will be financed on attractive terms or delayed, which introduces uncertainty and feeds the selloff.
Interest Rates: The Anchor That Suddenly Moves
Interest rates sit at the heart of USD liquidity crises. Often, such crises arise after a period of tightening monetary policy or sudden shifts in expectations about future rate paths. When policy rates rise aggressively or markets anticipate further hikes, dollar funding becomes more expensive. At the same time, risk-free yields climb, making equities—especially long-duration growth sectors like semis—less attractive on a relative basis.
In this environment, drawdown magnitude grows because two things happen at once. The discount rate applied to future semiconductor earnings rises, reducing their theoretical fair value, and the risk premium demanded by investors expands as uncertainty and volatility spike. Quarter by quarter, or sometimes week by week, these forces compound. A sector that had previously benefited from low rates and abundant liquidity now faces a dual blow: more expensive capital and more skeptical investors. The result is often a rapid descent from peak to trough, with drawdowns reflecting both macro repricing and panic-driven selling.
Exchange Rates: The Global Translation Problem
USD liquidity crises are almost always accompanied by sharp moves in exchange rates. The dollar tends to strengthen as global investors seek safety and as borrowers scramble to secure the currency they need to service debts. For semiconductor firms with significant non-dollar revenues or costs, this creates a translation problem.
A stronger dollar can reduce reported earnings from overseas operations when currency translation effects hit income statements. It can also strain customers in emerging markets, whose ability to pay for imported technology declines as their local currencies weaken. From the standpoint of drawdowns, these effects show up as a wave of earnings downgrades and cautious guidance. Investors see not only immediate funding stress but a potential slowdown in demand from key regions. The combination reinforces the selloff. Recovery duration, in turn, is affected by how quickly exchange rates stabilize and whether the dollar’s strength persists or fades as the crisis abates.
Credit Conditions: The Funding Squeeze
Credit markets act as the nervous system of USD liquidity crises. As dollar funding becomes scarce, credit spreads widen, issuance slows, and banks tighten standards. Semiconductor companies that planned to issue bonds or refinance loans suddenly confront higher costs or narrower windows of opportunity. Some may postpone projects, others may accept less favorable terms, and a few may face genuine stress if they entered the crisis with high leverage or aggressive investment plans.
This funding squeeze deepens drawdowns because investors quickly scan balance sheets and risk profiles. Firms with weaker credit metrics are punished more severely; those with stronger positions still see their valuations marked down to reflect a higher cost of capital and potential delays in expansion. The speed of the squeeze—in days or weeks rather than months—adds to the sense of urgency. Recovery duration then hinges on how quickly credit markets reopen. If central banks step in, swap lines are extended, and spreads retrace, semis can begin to recover as financing conditions normalize. If credit remains tight for an extended period, the sector’s recovery can be slow and uneven, with stronger players bouncing back first and weaker names lagging or never fully returning to prior highs.
Commodities: Costs in a Crisis

Commodities may seem peripheral to a USD liquidity crisis, but they influence the semiconductor story in subtler ways. Energy prices, in particular, affect the cost structure of fabs and data centers; specialized gases and materials impact production; and broader commodity trends can signal shifts in global demand. A crisis that coincides with falling commodity prices may alleviate some cost pressures for semiconductor manufacturers, even as revenue and funding stress rise. One that occurs amid rising or volatile commodity prices can exacerbate margin concerns.
For drawdown magnitude, the direction of commodity markets can either soften or harden the blow. Lower energy costs may give investors some comfort about operating expenses, but that comfort can be overshadowed by the broader liquidity and demand shock. Higher or unstable commodity prices, on the other hand, can lead to fears of margin erosion just as financing becomes harder, contributing to steeper declines. Recovery duration, again, is partly determined by how quickly commodity markets stabilize and whether firms can adapt their cost structures to the new environment.
Recovery Duration: Why Semis Often Take Time to Heal
If semiconductor drawdowns during USD liquidity crises are often sharp and deep, their recoveries can be more complicated. Some episodes produce V-shaped rebounds: policymakers act decisively, liquidity floods back into markets, and semis—seen as long-term beneficiaries of structural technology trends—snap back quickly. Other episodes lead to slower, grinding recoveries where prices retrace in stages, reflecting lingering macro uncertainty and delayed normalization in demand and financing.
Recovery duration tends to be linked to both the severity of the drawdown and the nature of the crisis. In crises where the primary issue is liquidity rather than solvency, and where policy response is swift, semis can rebound in months. In crises that reveal deeper structural imbalances—such as overcapacity, misallocated investment, or prolonged trade tensions—recoveries may take years. The sector might need time to digest excess inventory, realign production with realistic demand, and rebuild investor confidence. The longer the path, the more likely that some firms never fully return to prior peaks, even if the broader index eventually does.
Macro Linkages in the Recovery Phase
The same macro forces that amplify drawdowns also shape recovery. As interest rates stabilize or begin to fall, discount rates for future earnings drop, making growth assets like semis more attractive. A softer dollar can relieve pressure on emerging-market customers and improve reported earnings from overseas operations. Credit spreads tightening signal renewed confidence in corporate balance sheets and open the door to refinancing and new investment. Commodity markets finding equilibrium reduce uncertainty about costs and margins.
Recovery duration, therefore, is not merely a function of “time since bottom” but a reflection of how these linkages evolve. If policy support overcorrects, flooding markets with liquidity and pushing rates down, semis can experience not just recovery but renewed exuberance, sometimes risking another cycle of overvaluation. If support is cautious or delayed, markets may enter a long healing phase where prices climb in fits and starts, following each improvement in macro data and each successful refinancing or project completion.
Investor Behavior: Panic, Patience, and Positioning
Investor behavior is a crucial layer in understanding drawdown magnitude and recovery duration. During USD liquidity crises, the initial reaction is often reactive: sell what is liquid, reduce exposure to anything perceived as cyclical or complex, and raise cash. Semiconductor indices, being relatively liquid and widely held, can bear the brunt of this behavior, which adds a mechanical component to drawdowns beyond fundamentals.
In the recovery phase, behavior shifts. Some investors who sold in panic may re-enter cautiously, creating incremental demand as macro conditions improve. Long-term investors who held through the crisis may add positions at depressed prices, betting on structural trends in AI, automation, and digital infrastructure. Over time, as earnings stabilize and guidance becomes more predictable, these flows help drive prices higher. The pace at which behavior shifts—from fear to selective optimism to broad confidence—often matches the recovery duration. Faster behavioral shifts mean quicker recoveries; more cautious shifts mean drawn-out healing.
Not All Liquidity Crises Are the Same
It is tempting to search for a single rule: liquidity crisis equals X percent drawdown and Y months of recovery. Reality is more varied. Some crises are centered on the banking system, others on shadow finance or market structure; some are global, others more regional with dollar spillovers. In some episodes, semis are already overextended and richly valued going into the shock, which magnifies declines. In others, the sector may be reasonably priced or even under-owned, moderating the magnitude of drawdowns.
Similarly, recovery duration is shaped by context. A crisis that coincides with a strong underlying demand cycle—for example, a period when new applications for chips are emerging rapidly—may see semis rebound faster as fundamental growth overwhelms temporary funding stresses. A crisis that hits just as the sector is dealing with overcapacity or slowing end-market demand can lead to prolonged weakness, even after dollar liquidity returns. The macro linkages do not operate in isolation; they intersect with the sector’s own internal cycle of innovation, investment, and inventory.
Practical Lessons for Navigating Semis in Dollar Stress
For investors, the key is not to memorize specific numbers but to develop a framework. When signs of a USD liquidity crisis emerge—spiking funding costs, widening credit spreads, surging dollar indices, and tightening bank lending—assume that semiconductor drawdowns could be more severe than a typical correction. Recognize that the sector’s sensitivity to global trade, capital expenditure, and valuation multiples makes it vulnerable to both fundamental and flow-driven selling.
At the same time, consider the likely recovery path. Ask whether policy makers are prepared to address the liquidity problem, whether interest rates are near a peak or likely to fall, whether exchange rate stresses are easing, and whether credit markets are beginning to normalize. If the answer to most of these questions is “yes,” then the recovery duration may be shorter, and semis could offer attractive opportunities once the initial storm passes. If the answers are mixed or negative, patience is warranted, and investors may prefer to build positions gradually rather than rush back in after the first bounce.
A Flexible View of Risk and Resilience
Ultimately, the relationship between drawdown magnitude and recovery duration in semis during USD liquidity crises is a snapshot of how risk and resilience play out in a globalized, technology-driven economy. Semiconductors are indispensable, but they are not immune to funding stress, valuation repricing, and demand shocks. The sector’s long-term trajectory is shaped by innovation and structural trends, yet the path is punctuated by episodes where macro linkages dominate the narrative.
Adopting a flexible view means acknowledging that some crises will leave lasting scars, with certain firms never fully recovering, while others will serve as opportunities for strong players to consolidate and emerge even more dominant. For investors and companies alike, the lesson is to respect the power of USD liquidity as a driver of market behavior, to understand how interest rates, exchange rates, credit, and commodities interact in these moments, and to recognize that navigating semis through such episodes requires both macro awareness and sector-specific insight.
In that sense, the story of drawdown magnitude and recovery duration is not just about numbers on a chart. It is about how a critical industry weaves its way through the shifting tides of global finance—sometimes pulled under, sometimes lifted up, but always connected to the deeper currents of dollar liquidity and macro linkages in the financial system.
You May Like

Narrowing Spread Between NAND Spot and Contract Prices in 2026 – A Signal
By 2026, one of the most watched metrics in the NAND flash market has started to shift in a subtle but meaningful way: the spread between spot prices and long‑term contract prices is narrowing. For casual observers, this may look like just another incremental change in a notoriously volatile industry. For memory makers, module houses, device OEMs, and data center buyers, however, a tightening gap between spot and contract prices is a signal—a reflection of evolving supply–demand balance, risk perceptions, and strategic behavior on both sides of the market.

Price Divergence Trading Strategies Between NAND Flash and DRAM ETFs
NAND flash and DRAM sit at the core of AI storage and computing power. Both are memory, but they are not the same business. DRAM is main memory—fast, volatile, and central to high‑bandwidth workloads like AI training and inference. NAND is non‑volatile storage—slower than DRAM, but crucial to persistent data and large‑scale object storage. The cycles that drive their pricing and margins overlap, yet they often diverge. That divergence is where trading strategies between NAND and DRAM ETFs become interesting.

China’s HBM Localization Progress: The Catch-Up Pace of CXMT and XMC
China’s drive to localize advanced memory technologies has accelerated over the past several years. High-Bandwidth Memory (HBM) sits near the center of that strategy because it is integral to AI accelerators, high-performance computing (HPC) and other strategic compute platforms. Two domestic players—ChangXin Memory Technologies (CXMT) and XMC (Xianghui Memory, commonly referred to as XMC)—have become focal points in assessing how quickly China can close the gap with international incumbents on HBM die, stacking, and packaging.

Thermal Simulation Challenges and Solutions in 3DIC AI Chip Design
As AI workloads push chips to deliver ever higher compute density, designers are increasingly turning to three‑dimensional integration (3DIC) to stack dies vertically and pack more functionality into limited footprints. While 3DIC architectures unlock significant performance and bandwidth advantages, they also introduce complex thermal behaviors that are far harder to predict and manage than in traditional 2D layouts.

An Attempt at Compiling a Memory+Compute Fusion Thematic Index – A Dual-Track Framework
Most AI investors talk about “compute” as if it were the whole story: GPUs, accelerators, chips, cores. But every one of those cores needs somewhere to read from and write to. Memory and storage define how wide the data highway really is. In practice, AI performance is a fusion of compute and memory, not a solo act. So why do so many indices and ETFs separate them into different silos—one for semiconductors, one for memory, one for data centers—when the actual workloads keep blending them?
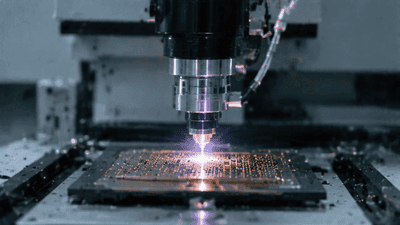
Surging Demand for Laser Drilling and Plasma Dicing Equipment in Advanced Packaging
Advanced packaging has become one of the semiconductor industry’s most important growth engines, and it is now pulling a surprising set of process tools into the spotlight. Among the most in-demand are laser drilling and plasma dicing equipment. These machines sit close to the heart of heterogeneous integration, fan-out packaging, wafer thinning, TSV formation, glass substrate processing, and other advanced flows where precision, yield, and throughput matter enormously. As packaging moves from a back-end afterthought to a strategic platform, the equipment used to shape, open, and separate materials has become just as important as the dies themselves.
D2D Interface Bandwidth and Latency Comparison in Chiplet Architectures
Chiplet architecture has turned the package into a real performance battleground. Once multiple dies are placed side by side or stacked within the same advanced package, the quality of the die-to-die, or D2D, interface becomes one of the most important determinants of system behavior. Bandwidth is no longer a nice-to-have metric, and latency is no longer a small implementation detail. Together, they shape whether a chiplet system feels nearly monolithic or frustratingly fragmented.

Stock Selection Logic and Alpha Validation of ESG-Themed Semi ETFs
Semiconductor themed ETFs are no longer just about growth and cycles. A growing subset now layers environmental, social, and governance (ESG) criteria on top of traditional sector exposure. These ESG semi ETFs promise two things at once: access to one of the market’s most powerful secular themes, and alignment with sustainability and governance standards. The pitch is appealing, but it raises two hard questions. First, how exactly are these stocks being selected? Second, does the ESG overlay help, hurt, or leave alpha unchanged?